Apachetail is a free real-time Linux Apache web server log monitoring tool that runs from a Windows Desktop. It connects directly via SSH to your Apache web server reading, parsing and analysing the logs in real-time. The logs are written to a local SQLite database and displayed in a dashboard showing detailed stats for your website. It reports visitor ip addresses, Browsers, Operating systems, status codes, webpage requests, referrers and combined stats over time similar to Google analytics. Its allows you to specify multiple logs on a single webserver so you can analyse multiple virtual hosts simultaneously. It can also now tail any linux logs into a combined real-time view.
Download

Requirements
Windows 10
Windows 8.1
Windows 7
Windows XP, Vista
Windows Server 2003
Windows Server 2008
Windows Server 2012
Windows Server 2016
32-bit and 64-bit versions are supported.
Microsoft .NET 4.0 which is freely available
from Microsoft’s website and may be already
installed on your computer.
Checksum SHA256
b43f6c6d2a09ebd024987fcae0a0384f
5cfa3b878dc16c509538ffd32e705df8

Overview
Apachetail was original designed for personal use to analyse my own Linux server Apache web server logs without having to use Google analytics which only shows stats for 1 site at a time in real-time. Also as I have seen in testing Google Analytics is not all that accurate. It doesnt catch all visitors to a page even though it has the analytics code. For example, GA doesnt detect visits from my Android Firefox browser at all, even when firefox protection is turned off! Another reason I dont like many of the apache log analyzers is because they require you to install software directly on the web server which I’d rather not. Apachetail is still in Beta but seeing that its quite useful I thought to make it available to other web server admins. Its portable and requires very little setup on your Windows desktop and Linux server other than making sure the log format on the Apache server is in the supported format. It doesn’t support Windows Apache servers at the moment but may in future. It has mainly been tested with a Centos server with a mild load so I’m not sure how well it will work with a high traffic server. Feel free to send through any feedback.
How Does Apachetail Work?
Apachetail connects from your Windows desktop to your Linux server using putty and SSH. It runs the “tail” command on the logs you specify and pumps the Apache logs back to a local SQLite database. Note that the password you configure in the profile is not saved and has to be entered each time your connect. Also the password is not sent until the SSH connection is established with the server. SSH port 22 will need to be open on the server and your IP address will need to be allowed to connect. If you can connect with putty from your desktop then Apachetail should be able to connect also. The account you specify must have read access to the logs on the server.
How to use Apachetail
Download the above zip file and extract it to a folder. You can verify the download using this
Virustotal link. Apachetail is completely
portable. To start Apachetail just run Apachetail.exe.
To begin using Apachetail you must first setup a new Profile or edit the default.
First, click the Config tab then click the Add button to create a new profile with default values.
Server IP Address – enter the ip address and port of the server that contains your Apache logs. eg. 192.168.0.10:22
Username – enter the username or the account that has SSH access to the server with read access to the apache logs.
Password – the password!
Apache Log Format – by default the combined format is used here but you can specify your own format. Apachetail has been designed to make use of the Referrer and User-Agent data so its recommend to use this format in your logs. The LogFormat directive is specified in your Apache servers .conf file. It must be the same as the log format specified here. Also Apachetail has mainly been tested with this format so other formats may or may not work correctly. Apachetail will parse the log format you specify here and in theory should be able to determine the ordering of your logs automatically but it hasn’t been fully tested with varying formats. Also make sure the quotes are left exactly as shown.
Apache Log Paths – enter the exact path to your Apache server’s request logs. This can be found in your Apache servers .conf file under the directive CustomLog. If the server is hosting multiple websites then you can enter each log you wish to monitor on a new line. Apachetail will create a new SSH connection for each log path you specify. Examples:
/var/www/mydomain1.org/requests.log
/var/www/mydomain2.org/requests.log
General Log Paths – enter the exact path to any of your server’s logs such as the apache error logs or the main syslog file. You can enter multiple paths on a new line. You can also use the new journalctl -f commands on Linux servers that support it. Examples:
/var/www/mydomain1.org/error.log
/var/www/mydomain2.org/error.log
/var/log/messages
/var/log/syslog
/var/log/maillog
journalctl -f
journalctl
–follow –lines=50
Status – once you have clicked the start button this field will show you the status of the connections to the server. If the connections are successful you should see listed the putty SSH process id’s as running. Also Apachetail’s main text bar will also show running and the total minutes its has been running.
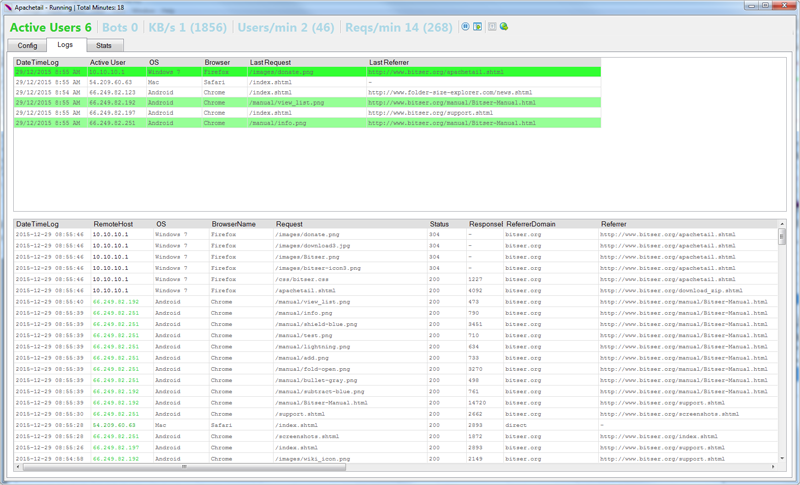
Apache Logs Tab
This tab shows 2 tables. The top table shows the current active users. It only shows the requests in the last minute. The bottom table shows the last 500 logs. The toolbar at the top of this tab allows you to filter logs so that they are not displayed and they are not added to the database. You can either use an include filter or and exclude filter. The filter will simple include or exclude any log that contains the text you specify. You can specify multiple strings by simply separating them with a space.
Troubleshooting Apachetail
Normally after you click the start button the status field should show something like the following if the connection is successful:
Established SSH Connection PID: 3188 – Running: True
If you have multiple Apache log paths specified then you should see one connection for each path. Also if you click the Logs tab you should see at least one log file shown in the tables. If the connection fails for whatever reason then you will see:
Connections closed
Connection failures are caused by one of the following:
- Server IP address is incorrect.
- Server is not allowing SSH connections from your ip.
- The server RSA key has not been accepted automatically. Normally when you connect via putty to a server for the first time you have to confirm acceptance of the server’s key. Apachetail normally does this automatically but may have failed. Try running Putty from the Apachetail directory and login to the server you are trying to monitor manually. Then try running Apachetail again.
- Firewalls in-between you and the server are not allowing your computer to establish a connection to the server on destination port 22. This includes your local firewall and the firewall on the server. Test logging in directly with putty.exe and plink.exe to confirm the connection is possible using SSH. Also ensure putty.exe and plink.exe are not being blocked by the Windows firewall.
- The password is incorrect.
- The account specified does not have login rights to the server or read access to the log paths. Again test logging into the server with Putty and running the tail command against the log paths you have specified.
General Tips
- The top table on the Logs tab shows the Active users. That is users that are currently on the site. The second they request a page they will appear in green. If they are idle for 2 minutes they will be removed from the active users table. The main table below the active user table shows their full request history as they navigate your site. The colour coding of the ip address will always be the same colour for a particular ip.
- The cells in the Apachetail log and stats tables can be double clicked. The contents are copied to the clipboard. If the cell contains a URL it will automatically open the link in your default web browser. Also if you double click a status code cell it will open Wikipedia showing a definition of that particular code.
- The main log table under the config tab will only hold the last 5000 logs.
- The Stats tab is only updated when you are in that tab. It will update every few seconds while you are in that tab. The data is always updated in the database but for performance reasons is only updated in the GUI while you are viewing it.
- Pausing the logging using the pause icon in the toolbar only pauses the GUI updates. The logs are still parsed and added to the database. The main logs table will not show the logs gathered while paused but the Stats will reflect all the data.
- The Apachetail directory is portable. Therefore you should be able to move it anywhere. The Apachetail.exe is digitally signed with a Symantec certificate. This means the exe cannot be modified without making the exe unsigned. You can also validate any of the exe’s in the Apachetail directory using any of the online tools such as www.virustotal.com
- Please note the OS and Browser detection is based on the User-agent string sent by the user’s browser. It not always accurate so bear that in mind.
- Stats are normally updated every 2 seconds. If Apachetail cant keep up with the updates it will automatically increase the update interval. You can see the update interval at the bottom of the stats page.
- At present it is only possible to run 1 instance of Apachtail on your desktop at a time. This will change in future versions.
Release Notes
Version 1.2 – 20th May 2018
- Added logging filters which allow you to include or exclude logs.
- Added the ability to monitor any log file on a linux server.
- Added a new tab that displays logs for general logs.
- Added experimental support for using “journalctl –follow.
- Added the ability to add and remove columns from displayed logs.
- Added the ability to change display font.
- Upgraded SQLite from ‘1.0.98.1’ to ‘1.0.108.0’.
- Upgraded Putty and Plink to the latest version.
- Updated the connection status text to provide more detail.
- Updated many parts of the GUI to improve the appearance.
- Updated the main toolbar display when logging is paused.
- Updated the general logging of the app iteself.
- Fixed a bug in the SSH key auto accept which used port 22 instead of the one specified.
- Fixed the app exit so that it closes connections and the database cleanly.
- Fixed minor bugs and optimised some code.
Version 1.1 – 17th November 2018
- Final Release
- Fixed minor bugs and optimised some code.
Version 1.0 – 8th January 2016
- Initial Beta Release
Screenshots